Introduction
Rice (Oryza sativa L.) is the staple food in Asia, Africa and Latin America. At present, global climate change makes excessive rain, flood, drought, salinity, cold etc. which negatively impacts on rice production. Consequently, the diverse attributes with diverse genes that can govern the yield structure over biotic and abiotic factors and the quality traits having indigenous/traditional, nutritional and medicinal values, need to be considered for future variety development of rice.
Duplicate(s) named rice germplasm occurred all over in Bangladesh (
Hamid et al., 1982). Among PCR based markers, microsatellite marker is highly polymorphic, more reproducible, co-dominant and well distributed throughout the rice genome (
McCouch et al., 2002) and elimination of duplicates (
Lund et al., 2003). Besides, rank coefficients/correlation (r
s) can be calculated by spearman rank correlation test (
Steel and Torrie, 1980) for comparison of different diversity analyses. Finally, the word ‘core’ means the central or the most important part.
Frankel (1984) originally termed a collection to ‘core collection’, which would represent, ‘with a minimum of repetitiveness, the genetic diversity of a crop species. The core would form the ‘active collection’, with the remainder being kept as a ‘reserve collection’. The main purpose of the core fraction is to provide efficient access to the whole collection. But limited work has been done on similar named rice of Bangladesh. With the above view in mind, the objective of the present study was to assess the diversity level, to compare the diversities and to select the core collection from similar or duplicate named rice germplasm of Bangladesh.
Materialsand Methods
Materials
Previously,
Ahmed (2015) characterized ninety-eight (98) similar or duplicate named rice germplasm of Aus, T. Aman and Boro seasons from Bangladesh; in which 40 from
Balam, 27 from
Jesso-Balam, 21 from
Kartiksail and10 from
Dhaliboro groups (
Table 1) with HYV’s on quantitative, qualitative and molecular characters for divergence studies.
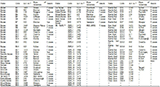
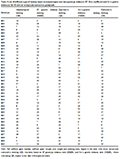
Table 1 Alphabetical list of the 98 genotypes with BRRI accession number
* = BRRI Genebank accession number, **=Jesso-Balam Transplant Aman Pure line, PBD=Plant Breeding Division
|
Cluster analyses
Ahmed (2015) also grouped the genotypes into ten clusters according to Mahalanobis’ D
2 statistics using GENSTAT 5.5 (
Table 2). Again, the UPGMA clustering grouped the genotypes into seven clusters based on Dice coefficient by using NTSYS-pc 2.2 (
Table 3). Finally, the UPGMA clustering according to 45 microsatellite markers (
Table 4) grouped the genotypes into ten clusters based on Nei’s genetic distance by using NTSYS-pc 2.2 (
Table 5).
.png)
Table 2 Distribution of 98 similar or duplicate named rice germplasm for 25 morpho-physicochemical characters based on Mahalanobis D2 statistics
Legend: B=Balam, JB=Jesso-Balam Transplant Aman Pure Line, KS=Kartiksail, DB=Dhaliboro and BR=BRRI Rice
|
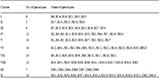
Table 3 Distribution of 98 similar or duplicate named rice for 19 qualitative agro-morphological characters based on UPGMA clustering using Dice coefficient
Legend: B=Balam, JB=Jesso-Balam Pure Line, KS=Kartiksail, DB=Dhaliboro; BR= BRRI Rice or BRRI dhan and NS=Nizersail
|
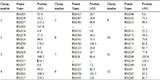
Table 4 List of 45 SSR primers used for molecular characterization of 98 similar or duplicate named rice germplasm
Ref: http://www.gramene.org.
|
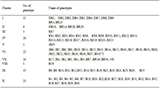
Table 5 Distribution of 98 similar or duplicate named rice germplasm based on UPGMA clustering using Nei’s genetic distance for 45 SSR markers
Legand: B=Balam, JB=Jesso-Balam PL, KS=Kartiksail and DB=Dhaliboro; BR=BRRI Rice or BRRI dhan, BM=Basmoti and NS=Nizersail
|
Diversity level
Form the data of the above studies, the diversity level according to Nei’s gene diversity index (H) (
Nei, 1973) and Shannon’s information index (H
s) (
Bowman et al., 1971), as well as analysis of molecular variance (AMOVA) were determined using Genalex 6.4 (
Peakall and Smouse, 2010) to fulfill the objective of the present study. For this, the 98 germplasm and 10 popular varieties were first divided into five population
viz., Balam land race cultivars (BLC) with 40 accessions,
Jesso-Balam cultivars (JBC) with 27 accessions,
Kartiksail land race cultivars (KLC) with 21 accessions,
Dhaliboro land race cultivars (DLC) with 10 accessions and high yielding varieties (HYV’s) with 10 popular varieties.
Rank coefficients (rs)
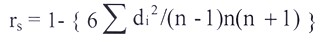
Spearman has devised the following formula for estimating rank coefficients (rs) in order to measure and compare the association between two criteria of rankings:
Where, di=Differences between two sets of rankings, n=number of observation and rs=spearman’s rank coefficient.
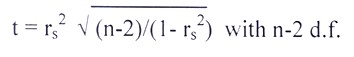
The estimated r
s were tested by ‘spearman’s rank correlation test’ using the criterion given by
Steel and Torrie (1980) as follows:
Core collection
The core collections were selected from 40
Balam rice germplasm according to the hierarchical cluster analysis (
Zewdie et al., 2004), where every accession sorted into a related sub-group from which a representative sample was drawn (
Brown, 1989a). To identify the sub-groups, first all the genotypes were subjected to cluster analysis based on Mahalanobis’ D
2 statistics for their representativeness (
Cui et al., 2004) and then selection of core collections was improved through evaluating compositively (
Singh et al., 1991), with sampling strategies based on genotypic/morphological values of the genotypes (
Hu et al., 2000), comparing different genetic distances, cluster methods and sampling strategies methods (
Xu et al., 2004), SSR marker base data (
Zhang et al., 2011) and geographic distribution data (
Li et al., 2004b).
Results and Discussion
Diversity level between the germplasm groups
The number of different allele ranged from 3.56 (DLC) to 7.80 (BLC) and the number of effective allele ranged from 2.63 (DLC) to 5.11 (BLC), respectively (
Table 6), whereas it was 5.18 and 4.14 for HYV population, respectively.
Hassan et al. (2012) reported 8.23 effective alleles in local cultivars group. The average number of private allele (allele found in a single population) among the populations ranged from 0.38 (DLC) to 1.44 (BLC) and it was 0.27 for HYV population. However, most of the private alleles were found in the land race populations. The results revealed that the gene diversity in land races of rice germplasm was higher than that of HYV group, indicating the presence of ample scope for incorporating new genes in HYV rice to broaden its genetic base.
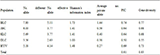
Table 6 Data on number of different allele, effective allele, shannon’s information index, private allele, PIC and gene diversity of different groups of similar or duplicate named rice germplasm
Legend: BLC=Balam land race cultivars, JBC=Jesso-Balam PL cultivars, KLC=Kartiksail land race cultivars, DLC=Dhaliboro land race cultivars and HYV= High yielding varieties
|
The genetic diversity in terms of Shannon’s information index was the highest (1.73) in
Balam land race cultivars and lowest (1.0) in
Dhaliboro land race cultivars, whereas it was 1.48 in HYV population. The result suggested that the land races of rice germplasm were more genetically diverse than our modern rice varieties. However, the average PIC value was 0.81 with a range from 0.50 for DLC to 0.74 for BLC, whereas it was only 0.69 for HYVs, indicating the existence of more diversity and broader genetic base in
Balam cultivars than the HYVs. Moreover, the genetic diversity was the highest (0.77) in BLC and lowest (0.55) in DLC, with an average of 0.83. It was also revealed that the gene diversity of HYV’s (0.73) was lower than that of BLC, suggesting wide range of diversity existed among the BLC land races. The result was in agreement to the finding on rice by
Hassan et al. (2012) and
Zhang et al. (2011). Besides,
Parsons et al. (1999) found 0.20 H and 0.33 H
s across 35 RAPD on 115 Bangladeshi rice and 0.12 H and 0.20 H
s across 21 RAPD on 80 Aus rice. While
Zhang et al. (1992) found 0.44 H
s across 43 RFLP on 26 Asia rice. However,
Yang et al. (1994) obtained the Nei’s gene diversity index as 0.66 across 10 SSR markers for 140 rice accessions originated in Asia.
Analysis of molecular variance (AMOVA) showed that the maximum percentage of variation was present among individuals within populations (85%), followed by among the populations (15%)(
Figure 1). But, no variation was observed within individuals, indicated that the variation present among the land races was greater than that of within the land races.
Hassan et al. (2012) also observed the maximum percentage of variation among individuals within groups (91%), followed by within the groups (9%), but no variation was observed within individuals.
.png)
Figure 1 Pie chart of analysis of molecular variance (AMOVA) of 98 similar or duplicate named rice germplasm across 45 SSR markers
|
Comparisons of diversity analyses
In order to measure and compare the association between the ranking of different genetic distance viz. ranking of inter-genotype distances estimated from principal coordinate analysis (PCoA) based on Mahalanobis’ D2 statistics, ranking of genetic distance estimated from Dice coefficient and ranking of genetic distance estimated from Nei’s genetic distances, the spearman’s rank correlation coefficients were estimated and t-test were performed to judge the significance of their associations.
Association between diversities based on quantitative and molecular data: The rank correlation coefficient value (r
s) was 0.51 and ‘t’ value was 2.98 with n-2 degree of freedom (
Table 7), which was highly significant indicating strong association between these ranking. This highly significant association revealed that both techniques were effective for estimating genetic distances and grouping of genotypes. The test also indicated that these independent sets of data likely reflect the same pattern of genetic diversity.
Rahman et al. (2011) also found highly significant correlation between morphological and molecular diversity (r
s = 0.32, t = 4.89 with 208 d.f.) by analyzing 21 rice varieties in respect of 13 morphological traits and at molecular level employing 34 SSR markers.
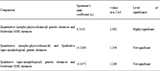
Table 7 Spearman’s rank coefficient among the different genetic diversity analysis of 98 similar or duplicate named rice germplasm
|
Association between diversities based on qualitative and molecular data: The rank coefficient value was -0.35 and “t” value was 1.27 (
Table 7), which was not significant indicating no association between these two methods of diversity analysis. It also suggested that the two systems give different estimates of genetic relations among the genotypes.
Association between diversities based on quantitative and qualitative data: The rank coefficient value was -0.33 and “t” value was found 1.11 (
Table 7), which was very close to the significant value. The result indicated the absence of association between these analyses.
Rahman et al. (2011) also found non-significant correlation between physiological and molecular diversity (r
s = -0.002, t = -0.03 with 208 d.f.) and close to the significant value between morphological and physiological diversity (r
s = 0.13, t = 1.88 with 208 d.f.).
Finally, the results revealed that the combination of quantitative and molecular characterization may be useful in studying genetic diversity as reported by
Cortese et al. (2010).
Selection of Core collections
The genotypes in the core collection should be potential, superior, representative as well as diverse. Considering this view, selection of one genotype having better traits along with additional criterion from each group/cluster was done. More or less similar strategies were also practices earlier by
Singh et al. (1991),
Hu et al. (2000),
Cui et al. (2004),
Li et al. (2004b) and
Upadhyaya et al. (2006). However,
Wang et al. (2007) also identified different evaluating parameters for rice core collection based on genotypic values and molecular marker information.
However, the cumulative ranking (CR) based on D
2 genetic distance ranking (DGDR) and Nei’s genetic distance ranking (NGDR), morphological ranking (MR) based on morpho-physicochemical characters and qualitative ranking (QR) based on Dice coefficient of 40 similar or duplicate named
Balam rice germplasm are presented in
Table 8.
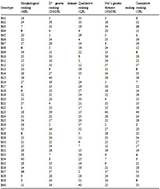
Table 8 List of different types of ranking based on morphological and inter-genotype distances (D2, Dice coefficient and Nei’s genetic distances) for 98 similar or duplicate named rice germplasm
Note: For unfilled grain number, unfilled grain weight, awn length and cooking time, higher is the rank with lower values and cumulative ranking (CR) was done based on D2 genotype distance rank (DGDR) and Nei’s genetic distance rank (NGDR), where (including QR) higher is the rank with higher diversity
|
Core collection of
Balam group: In Mahalanobis’ D
2 clustering, the B9, B14, B16, B21, B31 and B33 genotypes of
Balam group of rice were constellated in cluster I (
Table 2).
Brown (1989b) and
van Hintum (1995) also used hierarchical cluster analysis to develop core collection in rice. On the basis of D
2 genetic distance ranking (DGDR) estimated from principal coordinate analysis (PCoA) also based on Mahalanobis’ D
2 statistics, the diverse genotypes were B21, B33, B9, B14, B16 and B31 (
Table 8). UPGMA clustering method based on Dice coefficient, the genotype B33 was constellated in cluster II, genotypes B9 and B16 in cluster IV and genotypes B14, B21 and B31 in cluster VI (
Table 3). Nei’s genetic distance ranking (NGDR) estimated from Nei’s distances across 45 SSR markers, the diverse genotypes were B16, B33, B31, B9, B21 and B14. But, cumulative ranking (CR), the diverse genotypes were B33, B16, B9, B21, B31 and B14 (
Table 8). Again, UPGMA clustering method based on Nei’s genetic distance, the B9, B21 and B16, B33 genotypes constellated in sub-cluster of cluster VI, B14 in other sub-cluster of cluster VI and B31 in cluster VII (
Table 5). But, in morphological ranking (MR), B31, B16 and B14 were ranked better than others (
Table 8). Besides, the genotypes B14, B21and B33 were Aus, while B9 and B16 were T. Aman and B31 was the only B. Aman varieties. Finally, the selected first sub-set of core collection for
Balam group were B31, B16 and B14.
Wang et al. (2007) also mentioned that the key to improve the representativeness of a core collection is the scientific selection within groups.
Similarly, from B17 and B18 of cluster II (
Table 2), both were selected because both were morphologically ranked (MR) as 4 and 3.
For similar reasons, from B7, B13, B19, B20, B24, B25, B26, B27, B34 of cluster III (
Table 2), the selected core collections were B7, B24, B34, B19. Because B34 were the most diverse, B7 was morphologically ranked the highest, while B24 showed higher values for flag leaf length, primary branch filled grain number and protein percent and B19 showed higher mean value for flag leaf length and area, imbibition ratio and protein percent (
Ahmed, 2015) and was the only T. Aman variety among the land races. On the other hand, B26 and B34 were collected from Dhaka, B7 from Khulna, B19 from Jessor and B24 from Noakhali regions (
Table 1).
From B2, B6, B8, B15, B28, B30, B32 of cluster IV (
Table 2), the selected core collections were B8, B28, B2 because B8 were the most diverse, B8 and B28 were morphologically ranked as 6 and 8 (
Table 8), B2 was the only Aus variety and collected from Khulna region, while B8 and B28 were T. Aman varieties and collected from Pabna and Satkhira regions, respectively (
Table 1) among the germplasm.
From B1, B4, B5, B22, B23, B36, B37 of cluster V (
Table 2), the selected core collections were B22, B4 and B5. Because B5, B4 and B22 were the most diverse genotypes, while B22 and B4 were morphologically ranked as 1 and 9. Besides, B4 was the Aus variety of Sylhet, while B5 was collected from Moulovebazar and B22 from Khulna regions as T. Aman varieties (
Table 1).
From B3, B11, B29, B38, B39 of cluster VII (
Table 2), the selected core collections were B39, B38, B3 and B11. Because B39 and B3 were the most diverse, genotype B39, B38 and B3 were morphologically ranked as 2, 5 and 7 among the germplasm, while B11 showed the highest means for primary branch filled grain number and higher means for penultimate and flag leaf width, culm and plant height, culm diameter, primary branch number and filled grain weight and protein percent (
Ahmed, 2015). Moreover, B39 was collected from Satkhira, B38 from Chittagong, B11 from Comilla and B3 from Ranpur regions (
Table 1).
On the other hand, B12, B40 were placed together in cluster VI (
Table 2) and both were selected as morphologically ranked as 12 and 11 (
Table 8). But, none of the genotypes were considered as core collection from B10, B35 of cluster VIII, because both the genotypes had average genetic diversity and morphological performances. Beside, B10 was constellated in the same group with B8, B12, B15, B23 and B29, where as B35 was grouped with B7, B18 and B40 in UPGMA clustering method using SSR markers (
Table 5).
Li et al. (2004a) also reported the deviation sampling strategy in combination with the un-weighted pair-group average method of hierarchical clustering retained the greatest degree of genetic diversities of the initial collection. Similarly,
Upadhyaya et al. (2006) developed core subset of finger millet germplasm by using the geographical origin and the data based on quantitative traits.
Finally, the selected core collections of Balam group of land races were B2, B3, B4, B5, B7, B8, B11, B12, B14, B16, B17, B18, B19, B22, B24, B28, B31, B34, B38, B39 and B40.
Conclusions
The germplasm showed wide genetic diversity between groups (between JBPL1 and DB7, followed by B18 and DB7, B17 and DB7) and as well as within group (among B2, B5, B30 and B40). The morphologically potential diverse genotypes need to be utilized for broadening the new modern varieties. Molecular genetic distances is the most effective parameter for grouping. However, combination of quantitative and molecular characterizations may be the best for studying diversity. The selected core collections may be considered as ‘working samples’ in Genebank and their QTL mapping need to be done for unlocking valuable genes.
Ahmed M.S., 2015, Agro-morphological, physico-chemical and molecular characterization for developing core collections from similar named rice (Oryza sativa L.) groups of Bangladesh, Dissertation for Ph.D., Department of Genetics and Plant Breeding, BAU, Mymensingh, Bangladesh, Supervisor: Shamsuddin A.K.M., pp.41-179
Bowman K.O., Hutcheson K., Odum E.P., and Shenton L.R., 1971, Comments on the distribution of indices of diversity, Stat. Ecol., 3: 315-366
Brown A.H.D., 1989a, Core collections: a practical approach to genetic resources management, Genome, 31: 818-824
Brown A.H.D., 1989b, The case for core collections, In: Brown A.H.D., Marshall D.R., Frankel O.H., and Williams J.T. (eds.), The use of plant genetic resources, Cambridge University Press, Cambridge, UK, pp.136-154
Cortese L., Honig J., Miller C., and Bonos S., 2010, Genetic diversity of twelve switchgrass populations using molecular and morphological markers, Bio. Energy Res., 3: 262-71
Cui Y.H., Qiu L.J., Chang R.Z., and Lu W.H., 2004, Representative test for primary core collection of summer sowing soybeans in Huanghuai Region of China, Acta Agrono Sin., 30: 284-288
Frankel O.H., 1984, Genetic perspectives of germplasm conservation, In: Arber W., Llimensee K., Peacock W.J., and Starlinger P. (eds.), Genetic manipulation: impact on man and society, Cambridge University Press, Cambridge, pp.161-70
Hamid A., Nasiruddin M., Haque M., and Haque E., 1982, Deshi Dhaner Jat (Local rice varities), In: Taluckdar M.H.R. (ed.), Bangladesh Rice Research Institute, Joydevpur, Gazipur, Bangladesh, pp.ix-x
Hassan M.M., Shamsuddin A.K.M., Islam M.M., Khatun K., and Halder J., 2012, Analysis of genetic diversity and population structure of some Bangladeshi rice land races and HYV, J. Sci. Res., 4 (3): 757-67
Hu J., Zhu J., and Xu H.M., 2000, Methods of constructing core collections by stepwise clustering with three sampling strategies based on the genotypic values of crops, Theor. Appl. Genet., 101: 264-68
Li C.T., Shi C.H., Wu J.G., Xu H.M., Zhang H.Z., and Ren Y.L., 2004a, Methods of developing core collections based on the predicted genotypic value of rice (Oryza sativa L.), Theor. Appl. Genet., 108: 1172-76
Li Y., Shi Y.S., Cao Y.S., and Wang T.Y., 2004b, Establishment of a core collection for maize germplasm preserved in Chinese National Genebank using geographic distribution and characterization data,
Genet Resour Crop Evol, 51: 845-852
Lund B., Ortiz R., Skovgaard I.M., Waugh R., and Andersen S.B., 2003, Analysis of potential duplicates in barley Genebank collections using re-sampling of microsatellite data, Theor. Appl. Genet., 106: 1129-1138
McCouch S.R., Chen X., and Cho Y.G., 2002, Sequence divergence of rice microsatellites in Oryza and other plant species, Mol Genet Genomics, 268: 331-343
Nei M., 1973, Analysis of gene diversity in subdivided populations, Proceedings of the National Academy of Sciences USA, 70: 3321-3323
Parsons B.J., Newbury H.J., Jackson M.T., and Ford-Lloyd B.V., 1999, The genetic structure and conservation of Aus, Aman and Boro rices from Bangladesh. Genet Resour Crop Evol, 46: 587-98
Peakall R., and Smouse P.E., 2010, GENALEX 6.0: genetic analysis in Excel, Population genetic software for teaching and research, Mol. Ecol. Notes, 6: 288-295
Rahman M.M., Rahman M.A., Hossain A., and Rasul G., 2011, Comparative study on morphological, physiological and molecular genetic diversity analysis in rice (Oryza sativa L.), Libyan Agriculture Research Center Journal International, 2(2): 85-93
Singh S.P., Gutierrez J.A., Molina A., Urrea C., Gepts P., 1991, Genetic diversity in cultivated common bean: II. Marker-based analysis of morphological and agronomic traits, Crop Science, 31: 23-29
Steel R.D.G., and Torrie J.H., 1980, Principles and procedures of Statistics, A Biometrical Approach, 2nd edition, McGRAW-Hill Book Company INC., pp.550
Upadhyaya H.D., Gowda C.L.L., Pundir R.P.S., Reddy V.G., Singh S., 2006, Development of core subset of finger millet germplasm using geographical origin and data on 14 quantitative traits, Genet. Resour. Crop Evol., 53(4): 679-685
van Hintum Th.J.L., 1995, Hierarchical approaches to the analysis of genetic diversity in crop plants, In: Hodgkin T., Brown A.H.D., van Hintum Th.J.L., and Morales E.A.V. (eds.), Core Collections of Plant Genetic Resources, IPGRI, Rome, pp.23-34
Wang J.C., Hu J., Zhang C.F., Zhang S., 2007, assessment on evaluating parameters of rice core collections constructed by genotypic values and molecular marker information, Rice Science, 14(2): 101-110
Xu H.M., Qiu Y.X., Hu J., and Wang J.C., 2004, Methods of constructing core collection of crop germplasm by comparing different genetic distances, cluster methods and sampling strategies, Acta Agrono Sin., 30: 932-936
Yang G.P., Maroof M.A.S., Xu C.G., Zhang Q., and Biyashev R.M., 1994, Comparative analysis of microsatellite DNA polymorphism in land races and cultivars of rice, Mol Genet Genomics, 245: 187-194
Zewdie Y., Tong N.K., Bosland P., 2004, Establishing a core collection of Capsicum using a cluster analysis with enlightened selection of accessions, Genet Resour Crop Evol, 51: 147-151
Zhang P., Jinquan L., Xiaoling L., Xiangdong L., Xingjuan Z., and Yonggen L., 2011, Population structure and genetic diversity in a rice core collection (Oryza sativa L.) investigated with SSR Markers, PLoSONE, 6(12): 1-13
Zhang Q., Maroof M.A.S., Lu T.Y., Shen B.Z., 1992, Genetic diversity and differentiation of indica and japonica rice detected by RFLP analysis, Theor. Appl. Genet., 83: 495-499

 Author
  Correspondence author
.png)