Genetic Diversity Analysis for Earliness, Fiber Quality and Cotton Leaf Curl Virus in Gossypium hirsutum L. Accessions. 
 Author
  Correspondence author
Cotton Genomics and Genetics, 2015, Vol. 6, No. 2 doi: 10.5376/cgg.2015.06.0002
Received: 19 Mar., 2015 Accepted: 24 May, 2015 Published: 28 May, 2015
Saeed F, Shabbir R.S., Farooq J., Riaz M., and Mahmood K., 2015, Genetic Diversity Analysis for Earliness, Fiber Quality and Cotton Leaf Curl Virus in Gossypium hirsutum L. Accessions, Cotton Genomics and Genetics, Vol.6, No.2 1-7 (doi: 10.5376/cgg.2015.06.0002)
In the present set of experiment 159 cotton genotypes that were imported from USA were evaluated for cotton leaf curl virus disease tolerance, better fiber quality and various yield related traits. For evaluation of these traits cluster, principle component and correlation analysis was employed to obtain suitable parents that can be further exploited in future breeding programmes. Days to 1st square had significant positive correlation with days to first flower and had positive association with nodes to 1st fruiting branch whilst it showed negative correlation with fiber fineness. CLCuD exhibited highly significant negative correlation with plant height. Plant height showed highly positive significant association with sympodia per plant and monopodia per plant while it showed significant negative association with ginning out turn. The principle component analysis grouped total variation into 5 PCs in which first two contributed 34.2% to the total variability. Regarding cluster analysis the genotypes grouped into six clusters. The genotypes in cluster I, II and III comprised of genotypes with better earliness and fiber quality traits. Cluster IV was characterized by genotypes having less attack of CLCuD, higher GOT% and somehow good quality of fiber traits. Cluster VI was represented by genotypes having good plant height, sympodial branches per plant and fiber fineness. Genotypes of cluster I, II and III could be exploited in new breeding programs because of their better earliness and fiber quality traits. Cluster IV genotypes are good to utilize for better CLCuD tolerance and GOT% whilst cluster VI genotypes were suitable for plant height, sympodial branches per plant and fiber fineness.
The most widely cultivated species of the world is Gossypium hirsutum and it is the leading fiber crop grown in more than 80 countries (Shakeel et al., 2011). Cotton production in Pakistan faces the threats of both biotic and abiotic stresses. Among the most dominant factor limiting cotton production is cotton leaf curl virus disease (Farooq et al., 2011). This disease first reported in Pakistan during 1967 near Multan, since then it drastically affected major cotton growing areas of Pakistan. To exterminate this disease hard work has been made to develop resistant genotypes in Pakistan. Along with all the efforts, import of cotton leaf curl virus resistant germplasm was also done to broaden the genetic base which was missing in the current germplasm in Pakistan. Plant genetic resources and germplasm collections symbolize an important portion of the world’s natural resources. Genetic resources and germplasm collections are reservoirs of genes and genotypes necessary to protect humankind of present and future generations from emerging crop diseases and vulnerabilities. These germplasm resources protects mankind from future, and many times unforeseen, crop vulnerabilities, thus protecting future food, feed, and fiber supplies (Campbell et al, 2010).Currently different institutes are working on the development of CLCuV resistant varieties. One major project namely “Enhancing Cotton Germplasm, Improving Resistant to CLCuD, Supporting Cotton and Best Management Practices for small Farmers” funded by USDA is running in different research institutes of Pakistan. In this project, a lot of germplasm was imported from United States for screening of CLCV in Pakistan conditions. The development of superior cotton genotypes by hybridizing distant parental lines has been reported (Akter, 2009). To get particular information on nature and extent of genetic variability depends upon the various procedures exploited for its estimation, like plant characterization based on agronomical, morphological and physiological traits (Bajracharya et al., 2006). Multivariate study based on Mahalonobis’s D2 statistics (MDS), principal component analysis (PCA) and principal coordinate analysis (PCoA) are mostly utilized to estimate the extent of genetic diversity among the germplasm (Brown-Guedira et al., 2000). Among these biometrical procedures the main edge of principal component analysis (PCA) is that each genotype can be assigned to only one group and it also reflects the significance of largest contributor to the total variability at each axis of differentiation (Sharma, 1998). Genetic variation for morphological traits has been estimated using principal component analysis, which leads to the detection of phenotypic variability in cotton (Esmail et al., 2008; Li et al., 2008). The objective of present research was to evaluate the genetic diversity among cotton germplasms specifically for resistance against CLCuD and generally for morphological and fiber traits to recognize the model genotypes that can be exploited in future breeding program.
Results
Association among various studied characters
The basic statistics of different studied traits revealed considerable amount of variability among 159 exotic cotton genotypes (Table 1). Simple correlation coe- fficient revealed some important associations among the studied traits table 2.
|
|
.png)
|
|
.png)
Days to first square exhibited positive significant association with days to first flower and nodes to first fruiting branch while it had significant negative association with fiber fineness and negatively and non significantly correlated with plant height, monopodia per plant, sympodia per plant, boll weight and staple length. Days to first square showed positive significant association towards nodes to 1st fruiting branch and had negative non-significant correlation with plant height, monopodia, sympodia per plant , boll weight and fiber fineness. The CLCuD exhibited highly significant negative association with plant height while showed negative non-significant correlation with monopodia per plant and staple length. The plant height had highly significant correlation with monopodia per plant and sympodia per plant while showed highly significant negative association with GOT. On the other hand nodes to first fruiting branch exhibited significant negative association with fiber fineness and for staple length significant negative correlation was found with fiber fineness.
Principle Component analysis
In present set of experiment, out of total 11 (PCs) five principle component (PCS) were obtained having >1 Eigen value. All these five PCs contributed 65% in total variability amongst the upland cotton genotypes which were assessed for genetic diversity for fiber quality traits, earliness and CLCuD (Table 3). The remaining 35% of the total variability towards total variation was contributed by other components.
|
Table 3 Principle component analysis of different quality and morphological traits in cotton |
.png)
The PC1 contribution was highest (18.5%) amongst all other (PCs) towards the variability, while Pc II, PCIII, PC IV and PC V contribution was 15.6%, 10.5% and 9.7% respectively. The traits like days to first f, days to first flowering CLCuD, Nodes to 1st fruiting branch, GOT and staple length on PC1 exhibits considerable positive factor loading on the other hand plant height, monopodia per plant and fiber fineness had maximum negative loading. PCII contributed significant positive loadings for plant height, monopodia per plant and sympodia per plant while had significant negative loading for GOT, fiber fineness and CLCuD. In PC-III the variation among the genotypes was due to Nods per plant, staple length and CLCuD with significant positive loading whilst fiber fineness days to first seedling and days to first fruiting had significant negative loadings. PC IV elucidated by the variation among genotypes for staple length, boll weight and monopodia per plant with significant positive loadings, while sympodial per plant, CLCuD and nodes per plant showed significant negative loading. Similarly in PC V all traits had positive loading however boll weight, monopodia per plant and CLCuD were the major contributor towards the total variability with significant positive loading.
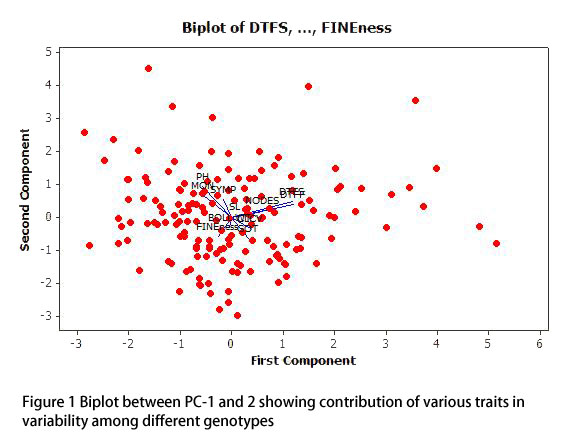
A PC bipolt figure 1 showed that genotypes and variables are super imposed on plot as vectors. The distance of each variable with respect to PC-1 and PC-2 exhibited share of these variables in the diversity of the genotypes used. The biplot figure depicted that as whole days to 1stsquare, flower and monopodia per plant share were maximum towards variability in germplasm.
|
Figure 1 Biplot between PC-1 and 2 showing contribution of various traits in variability among different genotypes |
Cluster Analysis
By using cluster analysis 159 exotic genotypes were grouped into 6 clusters on the basis of various traits (Table 4). That cluster I, II, III, IV, V and VI Comprised of 25, 18, 23, 46,27 and 20 genotypes respectively (Name of genotypes not shown). The genotypes in the first cluster represent reasonable values for days to first squaring, flowering, sympodial branches per plant, staple length and fiber fineness while for other traits selection cannot be made in this cluster. The members of 2nd cluster exhibited lower values for CLCuD, fiber fineness and GOT% whilst plant height, staple length and sympodia per plant showed higher values. The cluster III was characterized by genotypes having maximum GOT, staple length and fiber fineness. Cluster IV showed reasonable values for CLCuD, GOT and staple length. Cluster V was found suitable for only staple length while genotypes in cluster VI had maximum values for plant height and sympodia per plant. The first two principle components contributed almost 34.1 % in total variance. Among all clusters not a single cluster exhibited obvious separation.
|
Table 4 Cluster analysis of CLCuD, earliness and quality traits in various genotypes of cotton |
.png)
Discussion
The information of association among various traits facilitates to initiate any breeding programs as it aids to select genotypes having superior characters (Ali et al., 2009). In this set of experiment the correlation analysis results showed significant association among various traits. The days to 1st square had significant positive correlation with days to first flowering and had positive association with nodes to 1st fruiting branch whilst it showed negative correlation with fiber fineness. CLCuD exhibited highly significant negative correlation with plant height. Plant height showed highly positive significant association with sympodia per plant and monopodia per plant while it showed significant negative association with GOT. The positive association among various studied traits is important for selection of high yielding genotypes. Farooq et al. (2013) found significant positive association among yield and yield contributing traits and also found negative correlation among CLCuD and seed cotton yield. The exploitation and maintenance of genetic resources could be made more efficient by partitioning of total variance into its components. Meanwhile it also aids in utilization of suitable germplasm for improvement of particular plant character (Pecetti et al., 1996). Principle component analysis is a powerful technique that facilitates to get appropriate parental lines thus to initiate successful breeding program (Akter et al., 2009). In present set of experiment, PC analysis grouped total variation into 5 PCs. Saeed et al. 2014 reported significant higher contribution of 1st and 2ndprinciple component towards total variability. In present experiment 1st PC was elaborated by mainly due to days to 1st square, days to first flower and CLCuD. The 2nd PC was mainly explained by the genotypes having diversity for plant height and monopodia per plant. PC III contribution towards total variance was due to diversity among genotypes for nodes to 1st fruiting branch, staple length and CLCuD. PC IV elucidated by diversity among genotypes for staple length, monopodia per plant and boll weight with positive factor loadings.
Principle component analysis eventually validated ample amount of variation for the studied traits which could be exploited for planning a successful breeding program initiative aimed at refining earliness, CLCuD and fiber quality traits. Malik et al. 2011 and Ashokkumar and Ravikesavan 2011 reported that abundant amount of diversity in colored cotton genotypes allow opportunities to characterize color cotton genotypes.
Cluster analysis also assisted to elucidate adequate amount of diversity in this set of genotypes at different growth phases. The genotypes in cluster I, II and III comprised of genotypes with better earliness and fiber quality traits. Cluster IV was characterized by genotypes having less attack of CLCuD, higher GOT %and somehow good quality of fiber traits. Cluster VI was represented by genotypes having good plant height, sympodial branches per plant and fiber fineness. Genotypes of cluster I, II and III could be exploited in new breeding programs because of their better earliness and fiber quality traits. Cluster IV genotypes are good to utilize for better CLCuD tolerance and GOT% whilst Cluster VI genotypes are suitable for plant height, sympodial branches per plant and fiber fineness.
The existence of inclusive diversity between clusters is of great genetic values that allow selecting the genotypes with wider genetic base for better tolerance against CLCuD and earliness traits. Ayana and Bekele et al. reported similar kind of results for grouping of germplasm into various clusters.
Conclusion
In this present set of experiment PC analysis, correlation coefficient and cluster Analysis was employed that provide facilitation in grouping of genotypes and identification of genotypes having better tolerance against CLCuD, better fiber quality and earliness trait. The information gathered through correlation, PC and cluster analysis will be fruitful to design breeding programs to obtain genotypes possessing higher fiber quality, CLCuD tolerance and earliness traits.
Materials and Methods
Plant Material & Site Characteristics
A total of 159 genotypes were evaluated for this study carried out during the cropping seasons 2012-13 on 19th of June. The experiment was carried out at Cotton Research Institute, Faisalabad, Punjab, Pakistan.
Experimental Design, Plot Size & Cultural Practices
For each entry, plot size measured
Measurement of the studied traits
For measuring the traits 10 representative, undamaged plants were selected in each line and marked for identification. Data were collected for nodes to 1st fruiting branch counted from zero node (cotyledonary node) to the node at which first flower had appeared, number of days to first square and flower, plant height, monopodia and sympodia per plant, boll weight, and ginning out turn (GOT). For GOT cleaned and dry samples of seed cotton were weighed and then ginned separately with single roller electric ginning machine. The lint obtained from each sample was weighed and ginning out turn % was calculated by the following formula: Ginning outturn (%) = Weight of lint/Weight of seed cotton × 100, Fiber charac- teristics such as staple length, fiber fineness of each guarded plant were measured by using spin lab HVI-900.
Cotton leaf curl virus disease incidence (%) methodology
Cotton leaf curl virus disease incidence (%) and reaction of the cultivars was determined by using disease scale (Table 5) modified from the scale described by Akhtar et al (2010). Then percentage of CLCuD incidence was calculated by using the following formula. CLCuD incidence (%) = Sum of all disease ratings/ total number of plants ×25.
| Table 5 Rating scale for cotton leaf curl virus disease (CLCuD) symptoms |
Statistical Analysis
The average data of both the years were subjected to basic statistics, correlation analysis, cluster analysis and principal component analysis (PCA) using statistical software packages of SPSS version 19 and STATISTICA version 5.0 (Sneath and Sokal, 1973). Cluster analysis was performed using K-means clustering while tree diagram based on elucidation distances was developed by Ward’s method. First two principal components were plotted against each other to find out the patterns of variability among genotypes and association between different clusters using SPSS version 19.
Acknowledgements
This material is based upon work supported by the USDA Research Service under agreement No. 58-6402
References
Ahmad W., Khan N.U., Khalil M.R., Parveen A., Aimen U., Saeed M., Samiullah and Shah S.A., 2008, Genetic variability and correlation analysis in upland cotton. Sarhad Journal of Agriculture, 24: 573-580
Akhtar, K.P. Haider, S. Khan, M.K.R., Ahmad, M., Sarwar, N., Murtaza, M.A., and Aslam M., 2010, Evaluation of Gossypium species for resistance to leaf curl Burewala virus. Annals of Applied Biology, 157: 135-147.
http://dx.doi.org/10.1111/j.1744-7348.2010.00416.x
Akter, A., Hasan, M.J., Paul, A.K., Mutlib, M.M., and Hossain, M.K., 2009, Selection of parent for improvement of restorer line in rice (Oryza Sativa L.). SAARC Journal of Agriculture. 7: 43-50
Ali, M.A., Jabran, K., Awan, S.I., Abbas, A., Ehsanullah, Zulkiffal, M., Acet, T., Farooq, J., and Rehman, A., 2011, Morpho-physiological diversity and its implications for improving drought tolerance in grain sorghum at different growth stages. Australian Journal of Crop Science, 5(3):311-320.
Ali, M.A. Nawab, N.N., Abbas, A., Zulkiffal, M., and Sajjad, M., 2009, Evaluation of selection criteria in Cicer arietinum L. using correlation coefficients and path analysis. Australian Journal of Crop Science, 3: 65-70
Ashokkumar, K., and Ravikesavan, R., 2011, Morphological diversity and per se performance in Upland Cotton (Gossypium hirsutum L.). Journal of Agriculture Science, 3: 107-113
http://dx.doi.org/10.5539/jas.v3n2p107
Ayana, A., and Bekele, E., 1999, Multivariate analysis of sorghum (Sorghum bicolor (L.) Moench) germplasm from Ethiopia and Eritrea. Genetic Resources and Crop Evolution, 46: 273-284
http://dx.doi.org/10.1023/A:1008657120946
Bajracharya, J., Steele, K.A., Jarvis, D.I., Sthapit, B.R., Witcombe, J.R., 2006, Rice landrace diversity in Nepal: Variability of agro-morphological traits and SSR markers in landraces from a high-altitude site. Field Crops Research, 95: 327-335
http://dx.doi.org/10.1016/j.fcr.2005.04.014
Brown-Guedira, G.L., 2000, Evaluation of genetic diversity of soybean introductions and North American ancestors using RAPD and SSR markers. Crop Science, 40: 815–823
http://dx.doi.org/10.2135/cropsci2000.403815x
Campbell, B.T., Williams, V.E., and Park, W., 2009, Using molecular markers and field performance data to characterize the Pee Dee cotton germplasm resources. Euphytica, 169:285–301.
http://dx.doi.org/10.1007/s10681-009-9917-4
Esmail, R.M., Zhang, J.F., and Abdel-Hamid, A.M., 2008. Genetic diversity in elite cotton germplasm lines using field performance and RAPD markers. World Journal of Agriculture Sciences, 4: 369-375
Farooq, A., Farooq, J., Mahmood, A., Batool, A., Rehman, A., Shakeel, A., Riaz, M., Shahid, M.T.H., and Mehboob, S., 2011, An overview of cotton leaf curl virus disease (CLCuD) a serious threat to cotton productivity. Australian Journal of Crop Science, 5(12):1823-1831.
Li, Z., Wang, X., Yan, Z., Guiyin, Z., Wu, L., Jina, C., and Ma, Z., 2008. Assessment of genetic diversity in glandless cotton germplasm resources by using agronomic traits and molecular markers. Frontiers of Agriculture in China, 2: 245–252
http://dx.doi.org/10.1007/s11703-008-0063-x
Malik, W., Iqbal, M.Z., Khan, A.A., Noor, E., Qayyum, A., and Hanif, M., 2011, Genetic basis of variation for seedling traits in Gossypium hirsutum L. African Journal of Biotechnology, 10: 1099-1105
Pecetti, L., Annicchiario, P., and Damania, A.B., 1996, Geographic variation in tetraploid wheat (Triticum turgidum spp. Turgidum convar. Durum) landraces from two provinces in Ethiopia. Genetic Resources and Crop Evolution, 43: 395-407
Saeed F., Farooq, J., Mahmood, A., Hussain T., and Riaz M., 2015, Estimation of genetic diversity for CLCuD, earliness and Fiber quality traits in exotic germplasm of cotton using different statistical techniques in Gossypium hirsutum L. Pakistan Journal of Agricultural Sciences, 27(3):226-236.
Shakeel, A., Farooq, J., Ali, M.A., Riaz, M., Farooq, A., Saeed, A., and Saleem, M.F., 2011, Inheritance pattern of earliness in cotton (Gossypium hirsutum L.). Australian Journal of Crop Science, 5(10): 1224-1231


. PDF(282KB)
. FPDF(win)
. HTML
. Online fPDF
Associated material
. Readers' comments
Other articles by authors
. Frasat Saeed
. Rana Husnain Shabbir
. Jehanzeb Farooq
. Muhammad Riaz
. Khalid Mahmood
Related articles
. Cotton
. Cluster analysis
. CLCuD%
. Fiber quality
. Principle component analysis
Tools
. Email to a friend
. Post a comment