Development and Evaluation of Primary Introgression Lines of Rice by Advanced Backcross QTL Strategy for Gaozhou Wild Rice (O. rufipogon) 
2. College of Animal Science and Technology, Northwest A &F University, Yangling, Shaanxi 712100, China
3. Agronomic College of Xinjiang Agricultural University, Urumqi, 830052, China
 Author
  Correspondence author
Rice Genomics and Genetics, 2011, Vol. 2, No. 1 doi: 10.5376/rgg.2011.02.0001
Received: 17 Jul., 2011 Accepted: 18 Oct., 2011 Published: 29 Nov., 2011
Jing et al., 2011, Development and Evaluation of Primary Introgression Lines of Rice by Advanced Backcross QTL Strategy for Gaozhou Wild Rice (O. rufipogon), Rice Genomics and Genetics, 2011 Vol 2 (10.5376/rgg.2011.02.0001)
Rice (Oryza sativa L.) is the major cereal crop in China. The modern rice cultivars have narrow genetic base for most of the available traits, wild relatives of rice species contain trait-enhancing genes. The goal of this study was to identify introgression lines that can significantly increase yield in cultivated rice by yield-related traits from an inter-specific advanced backcross population (AB-population) between O.statia×O.rufipogon. AB-population (O. statia 'Yuexiangzhan'× O. rufipogon ‘G52-9’) has evaluated using statistical methods for 17 agronomic traits pertaining to yield and yield-related components. Our studies indicated that AB-population had higher values for most traits analyzed in comparison to the recurrent parent, Yuexiangzhan. According to the statistical results, about 33.20% of the BC3F1 lines showed better than Yuexiangzhan in some traits. Grain shape and grain weight have selected for QTL mapping as an illustration of AB-QTL analysis. A total of 23 QTLs were identified for grain length (GL), grain width (GW), Grain length/grain width (LW), and grain weight (GWt). Phenotypic variation of each QTL ranged from 3.77%-28.67%. The grain weight of the recurrent ‘Yuexiangzhan’ was improved 15.10%, 28.67%, 26.29%, 24.28% and 12.90% by five main QTLs of GWt (from Gaozhou wild rice). This study confirms that wild progenitor species present potential donor sources for some complex traits and the advanced backcross population provides an efficient source of gene pool for future breeding programs. Therefore, Gaozhou wild rice is an efficient source of gene pool and can further utilize.
In China, rice is an important food crop. With the trend of population growth and improved standard of living, food shortage is one of the most serious problems of this century. Therefore, to increase rice production is an essential assignment for rice breeding programs.
Wild rice is an important germplasm resource for rice improvement and rice breeding programs. It has formed abundant genetic diversity during the process of evolution and conserved many specific genes presently not available or lost in the cultivated rice (Xiao et al., 1998). Sun et al (2001) studies showed that the number of alleles of cultivated rice was 58.2% of wild rice on 44 RFLP loci. Their results also shown that the number of alleles decreased, the diversity of genetic was reduced, and some excellent of the genes were lost in cultivar rice during the process of evolution.
Tanksley and Nelson introduced the advanced backcross quantitative trait locus (AB-QTL) strategy in 1996, in order to map the favorable QTL alleles of exotic germplasm and introgression of these alleles into elite cultivate lines. Some studies derived from rice and tomato showed that this method is an efficient approach to excavate the favorable gene in wild germplasm resource (Xiao et al., 1998; Moncada et al., 2001; Septiningsih et al., 2003). The introgression of novel alleles from wild germplasm is one effective means for further improvement of agronomic traits, which has successfully used in many cultivated rice varieties as reported in some QTL mapping studies (Xiao et al., 1998; Moncada et al., 2001; Septiningsih et al., 2003; Tian et al., 2006). However, little information has focused on the systemic select methods for the introgression lines of some specific target traits. We aim is to present a systemic method that combines statistical analysis and molecular marker-assisted selection.
Oryza rufipogon accession No. G52-9 is a line of Chinese common wild rice (O. rufipogon Griff.); it grows in Gaozhou city of Guangdong province in China. Located at 21°42′34″~22°18′48″ N latitude and 110°36′48″~111°22′45″ E longitude, which in the transition region from South subtropics to North subtropics. To develop advanced backcross population is the first program of AB-QTL strategy. The purposes of this study were (1) to develop advanced backcross populations; (2) to evaluate yield and yield-related traits under standard farming conditions using statistical methods; (3) to select superior families of introgression lines for construct and cultivar development; (4) to introduce application of the advanced backcross quantitative trait locus (AB-QTL) strategy in rice. Other studies of detailed QTL mapping and introgression lines construction were also done with rice families used in this study.
1 Results
1.1 Evaluation of BC3F1 families
Mean, minimum, maximum, and coefficient of variation values for each trait are present in Table 1. Results from the T-test shown that the variance differences for grain shape and yield-related traits were highly significant (P<0.01 and P<0.001) for all traits except three morphological traits: days to heading, plant height and tiller number per plant. Grain number per plant, Spikelet number per plant, and grain yield per plant varied greatly (CV=32.32, CV=30.22, CV=29.99), in contrast to days to heading and 1000-grain weight (CV=6.79, CV=8.22). The results of trait phenotypic analysis of the 245 backcross families showed that the frequency distribution of all traits approximately fit normal distribution. As expected for an inter-specific cross, distribution of phenotypic values in progeny shown bi-directional deflective separation for all traits, except days to heading, tiller number per plant, grain length, Grain number per plant, Spikelet number per plant and grain yield per plant did not show a continuous distribution. All other traits demonstrated almost normal distribution (Skewness ranged from -0.65~ 1.05) (histograms not shown).
|
|
.png)
2.2 Correlations among all traits
Phenotypic correlations were calculated based on each means of the 17 phenotypic traits. The highest significant positive correlation (P<0.001) were found between DTH (days to heading)and TN (tiller number per plant) (0.354), 1000-GW (1000-grain weight) and PL (panicle length) (0.212), GNP (grain number per plant) and SNP (spikelet number per plant) (0.954), GN (grain number per panicle) and SD (spikelet density) (0.817), GY (grain yield per panicle) and PSS (percentage seed set) (0.487), and others not shown. SD (spikelet density) was significant negatively correlation (P<0.001) with 1000-GW (1000-grain weight) (-0.235), PPN (productive panicle number) (-0.232) and GL (grain length) (-0.218). All detailed character and pair correlations among the traits are show in Table 2.
|
|
.png)
2.3 Regression of grain yield per plant on other traits
Multiple regression analysis were calculated between grain yield per plant and the other 16 traits using BACKWARD method of PROC REG of SAS. Regression of Grain yield per plant (y) on other traits has a good model fit (F=838.23, R=0.977 8, P<0.000 1). The regression equation is y=-2.87-0.04x1-0.98x3- 0.11x4-0.92x5+0.80x8+0.01x10+0.18x11-0.01x12-0.10x13+2.09x14-2.72x15+8.00x16, where x1,x3, x4, x5, x8, x10, x11, x12, x13, x14, x15 and x16 denote respectively days to heading, panicle length, tiller number per plant, grain length, 1000-grain weight, grain number per panicle, spikelet number per panicle, spikelet number per plant, percentage seed set, productive panicle number, spikelet density, and grain yield per panicle.
2.4 Principal component based on data of 241 families
Principal component analysis was carried out based on data in Table 1 and the result from regression analysis. Principal component analysis is an effective multi-analysis that decreases the variable number of results of regression analysis. Table 3 and Table 4 show which of the 17 traits contributed most for grain yield per plant. Only seven traits were selected according to the eigenvalues, eigenvectors and Cumulative Percent: GN (grain number per panicle), PPN (productive panicle number), GL (grain length), GW (1000 grain weight), PSS (percentage seed set), DTH (days to heading), SD (spikelet density).
|
|
|
|
.png)
2.5 Selection of superior BC3F1 families
According to the results from Pearson correlation coefficients, regression analysis and principal component analysis, panicle length, grain number per panicle, 1000-grain weight, grain length, percentage seed set, productive panicle number and spikelet density were used to rank BC3F1 families. After ranking, 80 superior families (33.20 %) were selected for genotype analysis. For example, seventeen selected superior families are list in Table 5.
|
|
.png)
2.6 Genotype and introgression segment analysis for selected superior families
Candidate lines of the development of introgression lines were selected based on genotype analysis. The proportion of segment introgression from O. rufipogon ranged from 0.80%~41.50%, with an average introgression of 20.62% in BC3F1 families. The average was different from the expected heterozygous portion of an unselected BC3F1 family, which would be 12.5%. Two markers with extreme proportions are near 0%. The results of genotype analysis by GGT software are show in Figure 1. The selected backcross introgression lines combined with the number of different introgression for any specific region determines the locations of the QTL analysis.
|
|
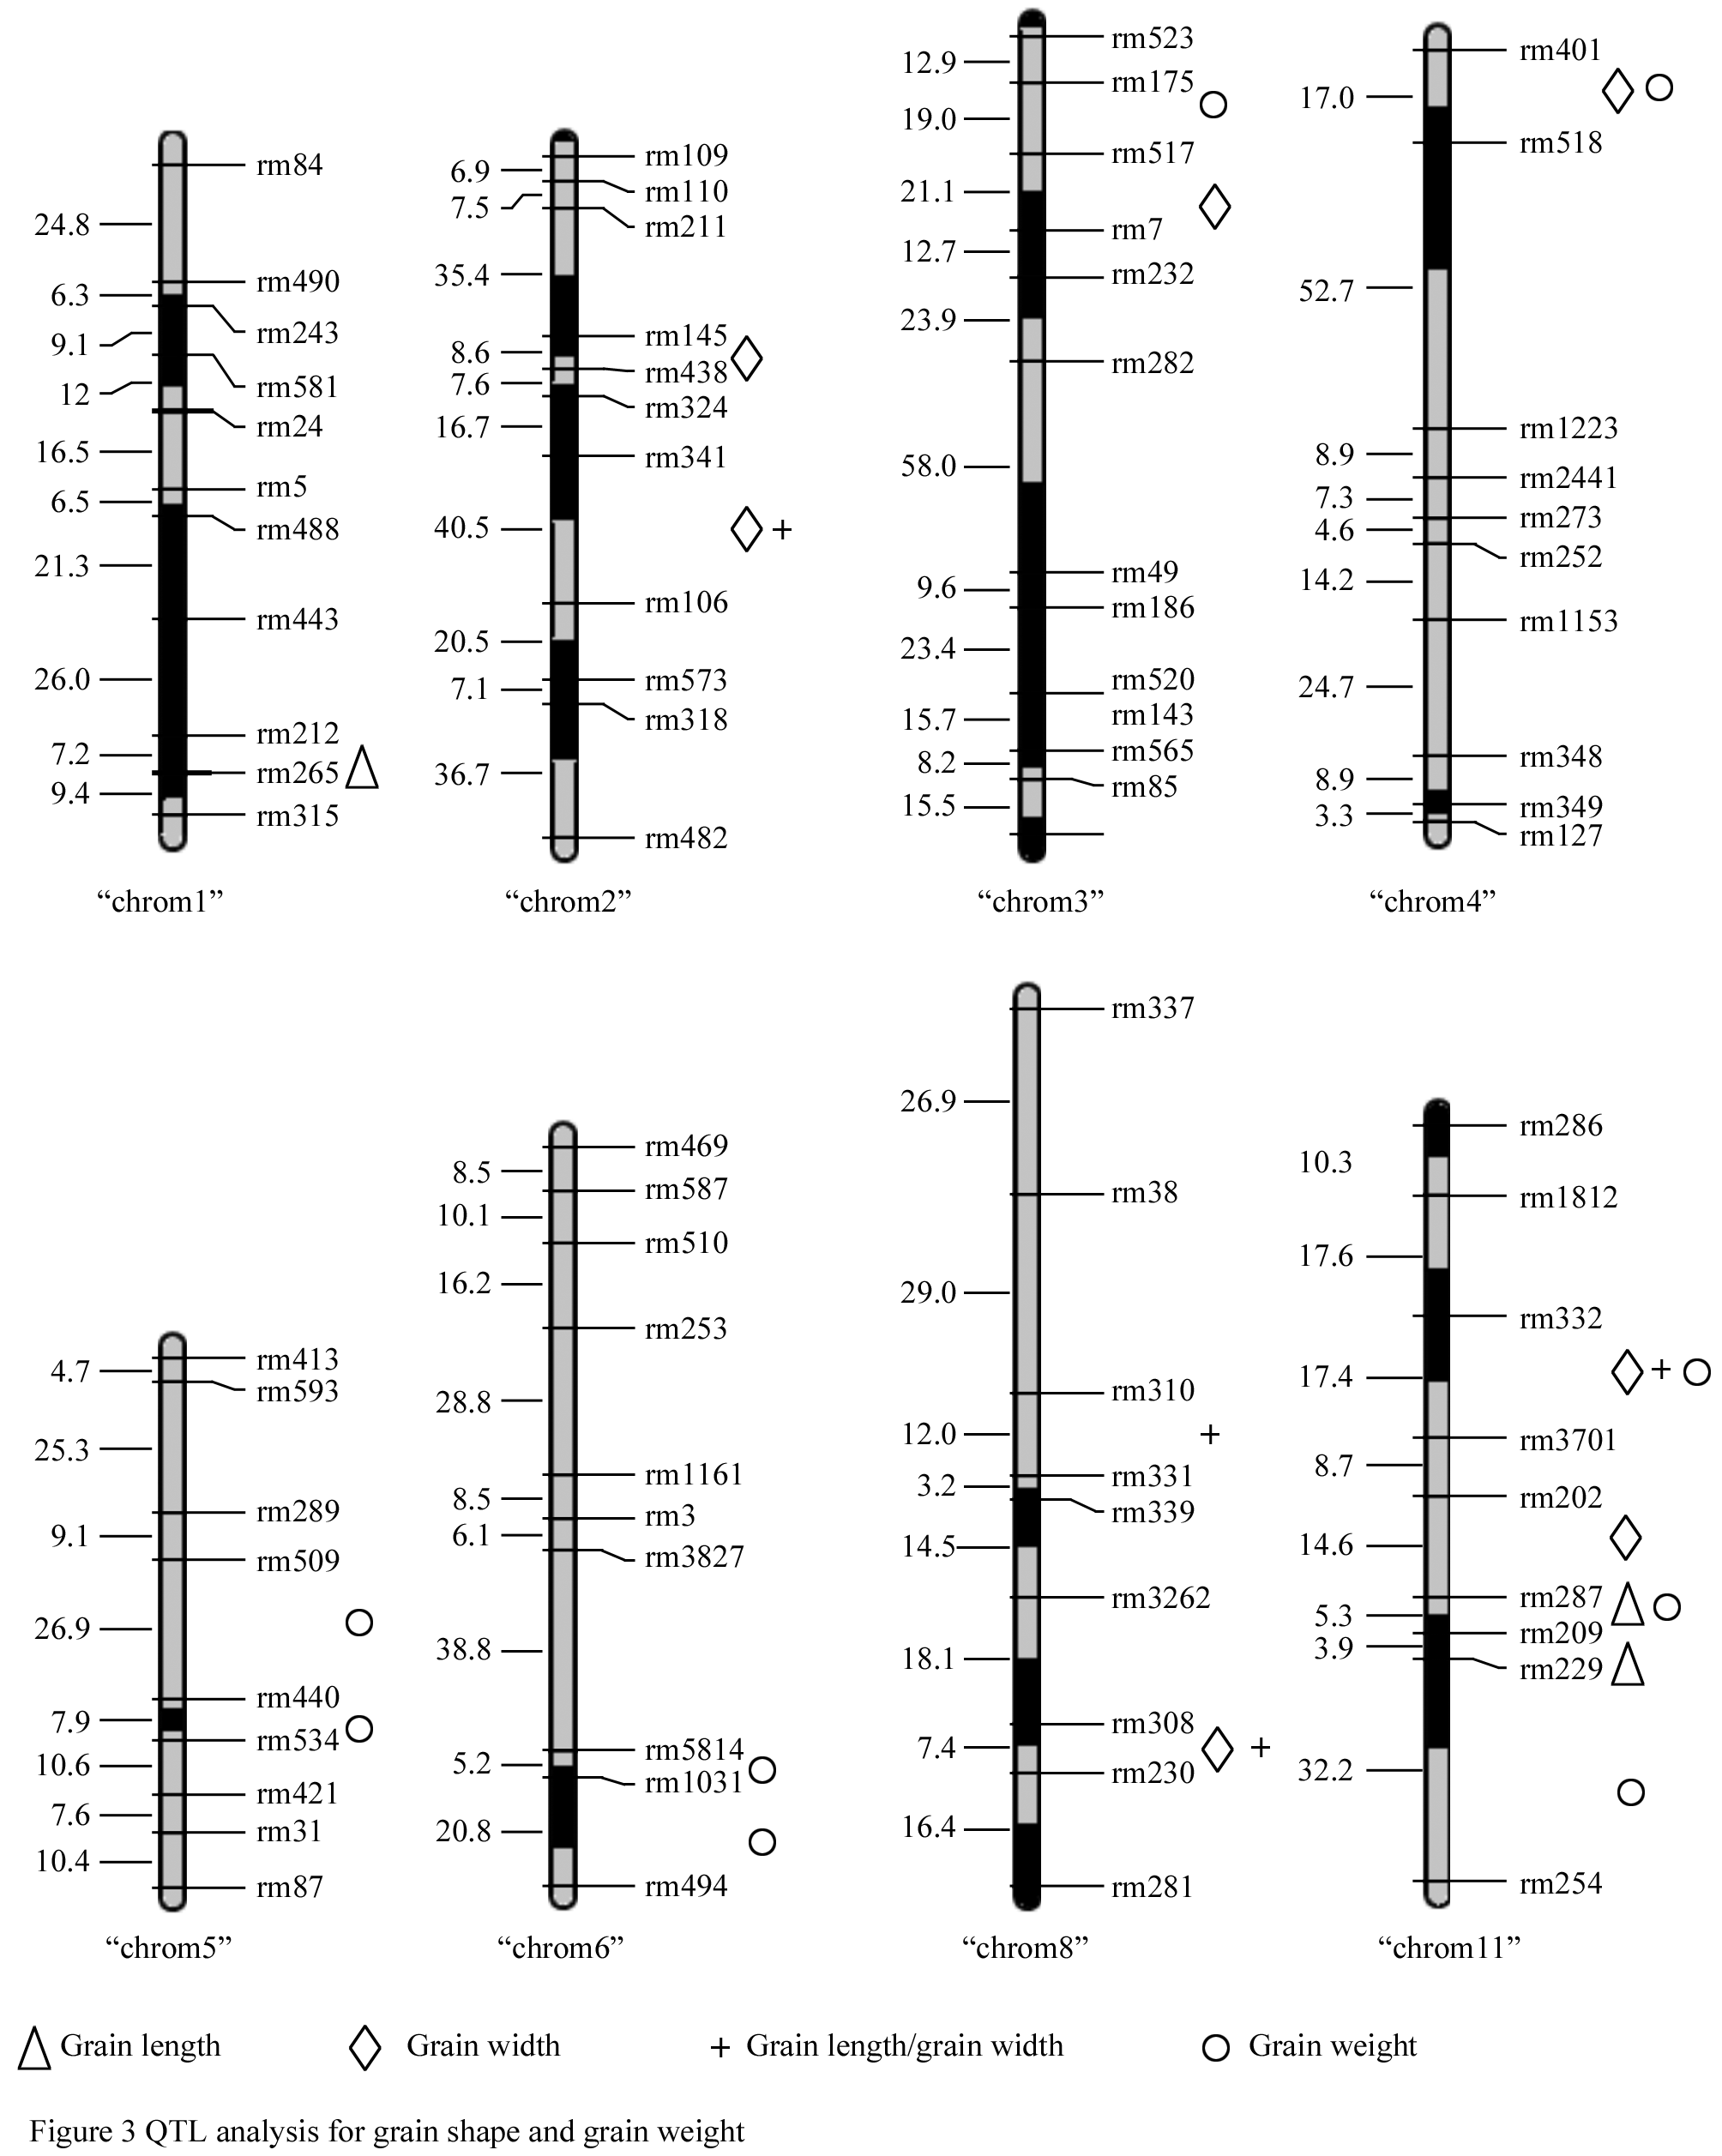
2.7 Detection of QTL
Based on the 117-polymorphism SSR markers, 23 QTLs for grain length, grain width, and Grain length/grain width and grain weight have detected at eight chromosomes for Gaozhou wild rice. The Gaozhou wild rice QTL allele was associated with an improvement of agronomic traits (Figure 2). For example, at locus rm440 on chromosome 5, the homozygous wild rice genotype can increase grain weight by 28.67%.
|
|
2.8 Construction of introgression lines and develop ment of QTL-NILs
Introgression lines (ILs) and near-isogenic lines (NILs) are efficient tools for precise mapping of QTLs and validation of gene function. In our studies, candidate lines of the development of ILs were selected according to statistic analysis and introgression segment analysis of heterozygote. Polymorphism markers can be used to analyze the genotype of the selected lines in the BC3F3 population. Lines carrying homozygous introgressed segments derived from Gaozhou wild rice selected as the ILs. Simultaneously, QTL for some traits that were found putative QTL in BC3F1 lines can be conducted and validated. Production of QTL-NILs carrying identified favorable QTL alleles from common wild rice will be done.
2 Discussion
Utilization of wild germplasm as donors in inter-specific crosses is one of the strategies to broaden the genetic diversity of the rice gene pool. Over the last decade, wild species in rice have successfully utilized for incorporation of yield-enhancing genes. In an earlier study, Xiao et al (1998), Septiningsih et al (2003), and Thomson et al (2003) shown that quantitative trait loci (QTL) alleles from Oryza rufipogon access .No. IRGC105491 had a beneficial effect for yield potential of cultivated rice by as much as 20%, 33%, and 53%, respectively.
Gaozhou wild rice is the largest wild rice population in Guangdong Province, covering about 15 hectares. Gaozhou wild rice grows without obvious winter dormancy; it is evergreen all the year round. Heading once a year, it is a brown grain with small panicles and low seed setting percentage. As a precious rice germplasm resource, it contains some desirable traits, including strong tolerance to disease, insect, cold, and low fertility (Li et al., 2006). Li et al (2006) have studied the genetic diversity of Gaozhou wild rice by using SSR markers, and the results shown that Gaozhou wild rice is probably the largest center of genetic differentiation and diversity of common wild rice from Guangdong province, south China, and even whole China. The result also shown that Gaozhou wild rice may be conserve many specific genes presently not available or has been vanished in the cultivated rice. In this study, we construct an advanced backcross of Gaozhou wild rice for first time in China.
The six traits expressed a discontinuous distribution that might be due to phenotypic variability of AB- population and the abundant genetic diversity of Gaozhou wild rice. Chen et al (2008) reported the phenotypic diversity of Gaozhou wild rice was plentiful.
In this study, grain number per plant, spikelet number per plant, and grain yield per plant had the highest percent phenotypic variance that is associated with that reported by Chen et al (2008). Regression analysis can help to select the most important variables that affect yield components in rice. In this study, grain yield per plant was regressed as a dependent variable on all other traits, with an F-value of 838.23. The result indicated that dependent variable and independent variables have a good model fix (R=0.977 8, P<0.000 1), which indicated that the first regression is suitable for 12 selected traits. These traits were used to analyze principal component and determine candidate traits that future rank and select superior BC3F1 families for cultivar development and construction of introgression lines. The present study confirms that most major components with yield were significant positive relationship. Correlations among traits (Table 2) indicated the highest positive correlation (P<0.001) is for grain number per plant × spikelet number per plant (0.954) and grain yield per panicle × grain number per panicle (0.936); a similar positive correlation between the same traits was reported in earlier studies (r=0.769 and r=0.411, Septiningsih et al (2003)). 1000-grain weight was negatively associated with both spikelet number per panicle (-0.148) and grain number per panicle (-0.088). These results confirm with those reported earlier for studies involving O. rufipogon (Xiao et al., 1998; Septiningsih et al., 2003; Thomson et al., 2003). In the present study, the correlation between 1000-grain weight and yield was significant as also reported earlier (Xiao et al., 1998; Thomson et al., 2003). However, other studies reported no significant correlation between other yield-related traits and 1000-grain weight. These different results in correlation coefficients among traits in different studies can be due to the different parents and environment.
Not all of the 80 superior families are suitable to construct introgression lines. For example, 17 selected good-performing lines are not always higher than Yuexiangzhan for evaluated traits; the percentage seed set is lower than Yuexiangzhan. In breeding programming, it should adjust according to different goal for cultivar development or gene exhume. For gene finding, the selected families should choose for inferior and superior traits simultaneity. The numbers of QTLs for grain shape and grain weight in this study is higher in comparison to earlier studies with O. rufipogon. This result is 1.77 times as much as Lee et al (2005). The same population is being genotyped for QTL mapping in another study. These studies confirm that wild progenitor species present potential donor sources to improve some complex traits and the AB-population provide an efficient source of gene pool for future breeding programs. Gaozhou wild rice is an abundant source of gene pool and can be utilize further. Therefore, it is necessary to expand ILs and NILs-carrying single wild rice for future project.
Wild species usually show inferior agronomic characteristics compared to cultivated species. For example, to exist badness agricultural character and bad linkage genes; upper adverse gene frequency of wild rice in balanced population and genetic drag affected the utilization presently, and these bring some difficulties to find the elite gene of germplasm resource of wild rice. The present study and earlier some results (Bernacchi et al., 1998a; 1998b) indicated AB-QTL analysis is feasible to find the available genes, and shown that wild rice still contain some valuable trait enhancing genes during the process of evolution from common wild rice to cultivated rice.
3 Materials and Methods
3.1 Development of AB population
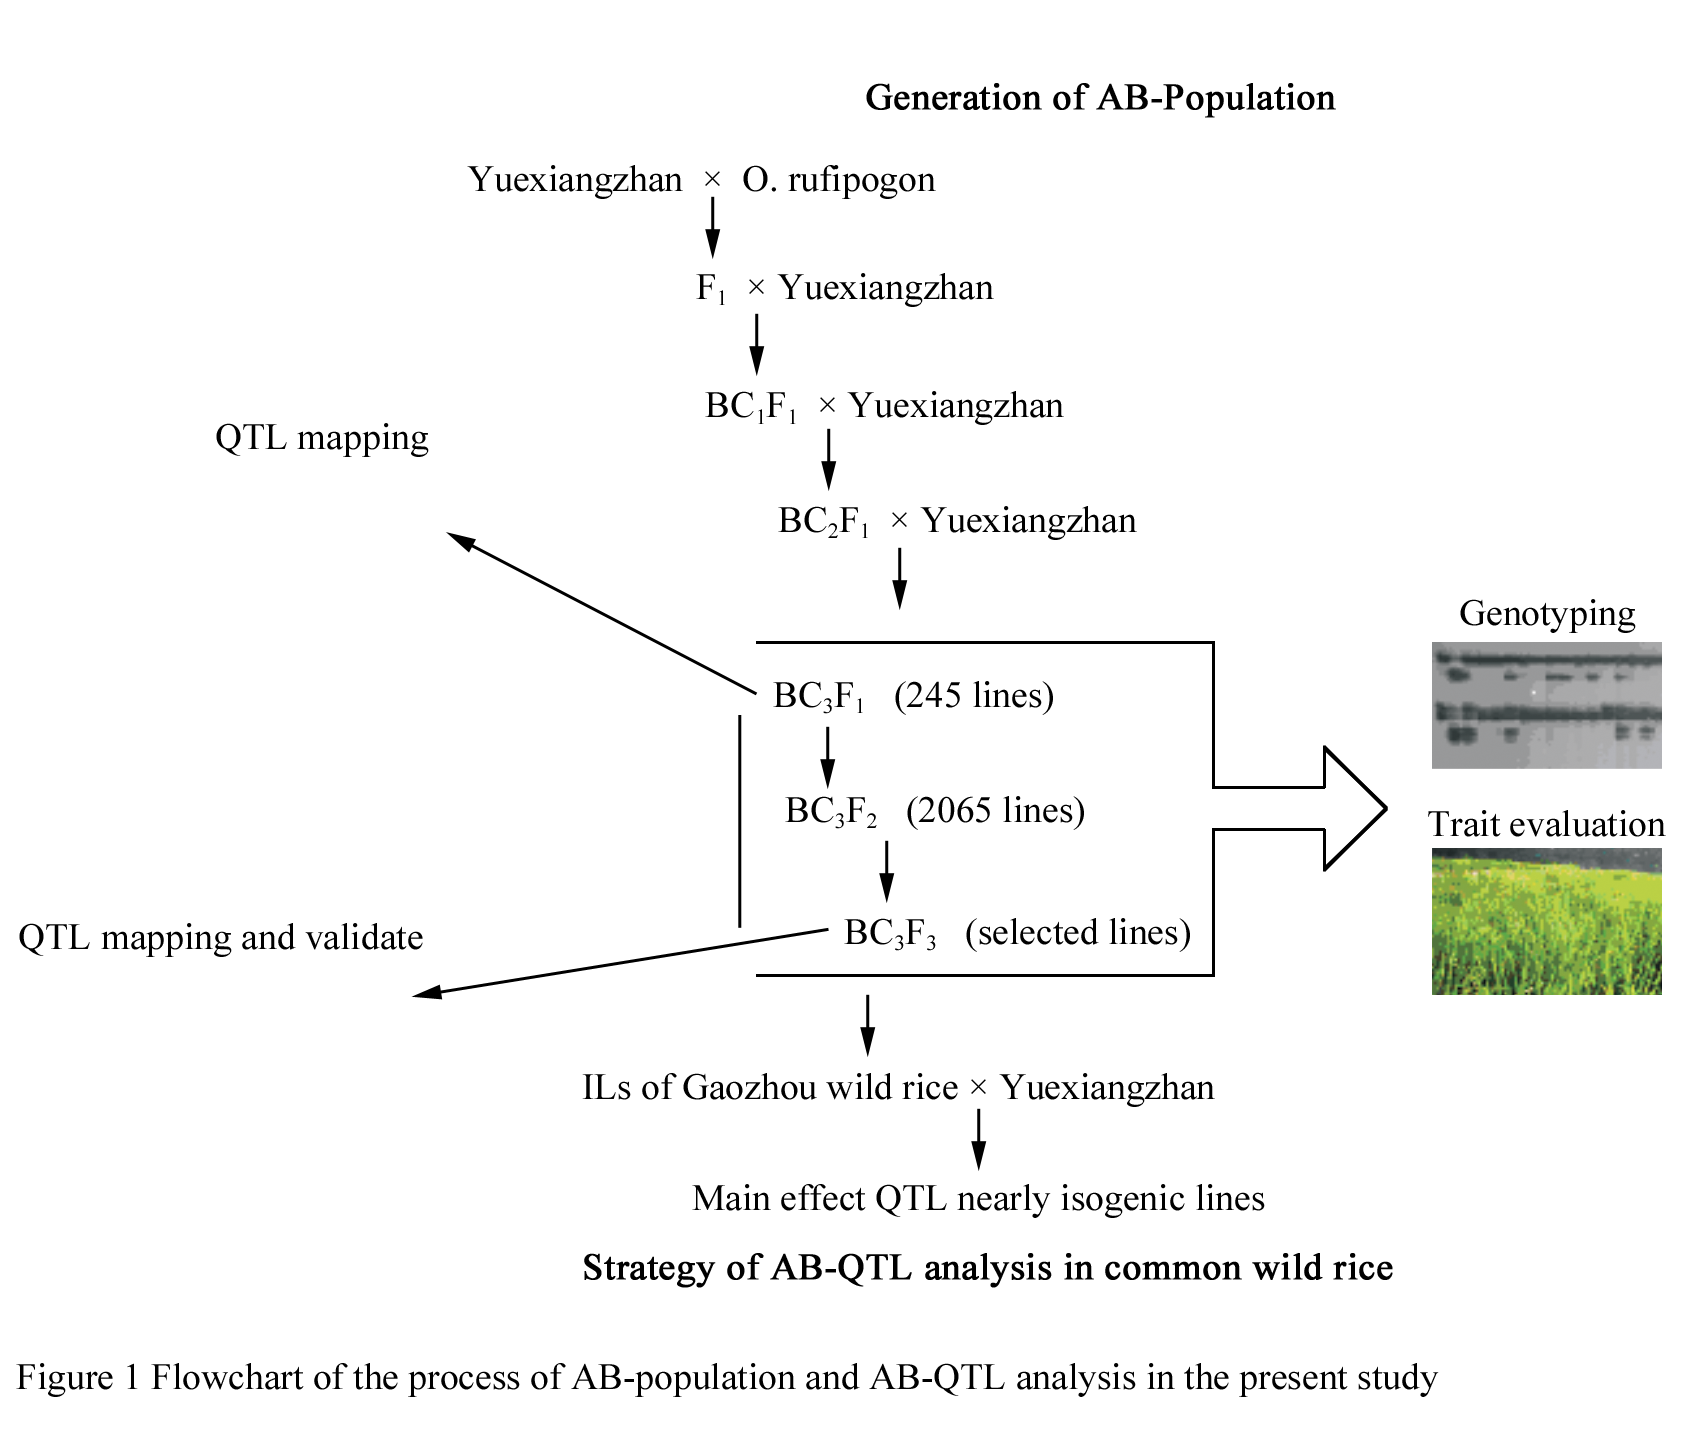
An AB-population resulting from crosses of O. sativa × O. rufipogon were used in this study. ‘Yuexiangzhan’ (O. sativa ssp. indica), an elite cultivar, was used as the female and as the recurrent parent. 52-9, a line of Chinese common wild rice (O. rufipogon Griff.), from Gaozhou of Guangdong province in China, was used as the donor and crossed to ‘Yuexiangzhan’ to generate F1 plants. F1 plants were backcrossed three times consecutively to ‘Yuexiangzhan’ to produce BC3F1 plants. BC3F1 populations consisting of 245 lines have generated in this experiment (Figure 3).
|
|
3.2 Field experiment and trait evaluation
Two hundred and forty five BC3F1 lines and the recurrent parent ‘Yuexiangzhan’ were planted at DaFeng Experiment Station of Guangdong Academy of Agricultural Sciences, Guangzhou, in August of 2007. The field experiment management according to normal rice production conditions was used as required. Each line consist 50 plants planted by 5 rows of 10 plants adopting uniform spacing of 10 cm × 30 cm. Randomized complete block design with two replications was used.
241 BC3F1 lines were selected for the evaluation of trait and SSR genotype analysis. For statistic analysis, the two replications were averaged. Ten plants in the middle of each plot were evaluated for the 17 yield related traits. At harvest time, ten plants from each plot were chosen for the evaluation of four traits: (1) days to heading (DTH) - the number of days from seeding until 30% of panicles of the 10 plants were heading. (2) plant height (PH) - from soil surface level to the base of the panicle. (3) panicle length (PL) – from panicle neck to the panicle tip (excluding awn). (4) tiller number per plant (TN) - the total number of tiller per plant. After harvesting, yield and yield-related traits were evaluated based on the performance of 241 BC3F1 lines, with recurrent parent as controls. Traits evaluated include: (5) 1000-grain weight (1000-GW) - the mean weight of 1000 fully filled grain of five different panicle per plant in grams, (6) grain number per panicle (GN) - the mean value of five panicles from each of the 10 plants, (7)grain number per plant (GNP) - product of filled number of grain per panicle and productive panicle number, (8) spikelet number per panicle (SN) -number of spikelets (including both filled and empty ones) averaged from five panicles in each plant, (9) spikelet number per plant (SNP)-total number of spikelets (including filled and empty ones) in each plant computed as the average number of spikelets per panicle multiplied by the number of productive tillers, (10) percentage seed set (PSS)- ratio of grain number per plant to spikelet number per plant, expressed in percentage, (11) productive panicle number (PPN)-total number of panicles of filled number more than five, (12) spikelet density (SD)- the mean value of grain number per centimeter in five spikelets. (13) grain yield per panicle (GY)-weight(g) of filled grains per panicle, and (14) grain yield per plant (GYP)-weight (g) of filled grains of per plant. In addition, (15) grain length (GL), (16) grain width (GW), (17) grain length/grain width (LW) were estimated from 10 grains per plant using a vernier caliper. For each trait, the mean values of two replications were calculated and used in data analysis.
3.3 Detection of introgression and genotyping with markers
DNA was extracted from fresh leaves of 245 field-grown BC3F1 lines. DNA extraction was performed using the protocol of Li et al (2006). A total of 117 polymorphic simple sequence length repeat (SSR) markers from published information were used to analyze the 241 lines (Chen et al., 1997; Temnykh et al., 2001; MoCouch et al., 2002). The polymerase chain reaction (PCR) conditions were as described in Chen et al (2008), with the following modifications: a total volume of 10 μL reaction mixture was composed of 2 ng/μL of template DNA, 1 μmol/L primers, each 1 μL of 10 mmol/L dNTPs, 50 mmol/L KCL, 10 mmol/L Tris-HCL (pH=9.0), 1.5 mmol/L MgCl2, and 0.75 U Taq polymerase. PCR amplification conditions were as follows: denaturing at 94℃ for 5 min, followed by 35 cycles of 94℃ for 30 s, 55℃ for 1 min, and 72℃ for 2 min, and lastly, 8 min at 72℃. SSR analyses were performed on 6% polyacrylamide denaturing gels.
3.4 Data analysis
The data of this paper were analyzed in SAS/STAT User’s Guide Release 8.2 in 1992. Various elementary descriptive statistics were calculated using PROC MEANS for each trait (parental and progeny). Analysis of BC3F1 population phenotype variance was conducted using the General Linear Model (GLM) procedure. Normal distribution test of all traits were determined using PROC GCHART. The trait Pearson correlation coefficients were calculation at P<0.05, P<0.01 and P<0.001 using PROC CORR. Regression analysis was performed using PROC REG. Principal component analysis was carried out based on PROC FACTOR. Genotype and introgression segment of wild were analyzed using GGT software (http://www.plantbreeding.wur.nl/). Detection of QTL was conducted using QTL Cartographer Ver.2.5 (Basten et al., 1997).
Authors' contributions
ZBJ and CL conceived the overall study, performed the experiment designs, and drafted the manuscript. ZBJ, CY and DJP took part to the data analysis and the writing. YYQ, ZLF and JYC obtained and analyzed the data and were involved in the writing. All authors read and approved the final manuscript.
Acknowledgements
We thank Lisa Yu (Department of Biochemistry, University of Toronto, Toronto, Ontario, Canada M5S 1A8) for critical reading and formatting of this manuscript. Wang Xiang kun (Department of Plant Genetic and Breeding and State Key Laboratory of Agro biotechnology, China Agricultural University) for help instruction on the experiment. The work was supported by the National Key Technology R&D Program (NO. 2006BAD13B01-11), Agro-scientific Research in the Public Interest: Protection and Utilization of Wild Plant Resources (201003021); Fund for basis Scientific and Technical Supporting Programs of Guangdong province (2006B60101021) ,The Key basis Project of Scientific and Technical Supporting Programs of Guangdong Academy of Agricultural Sciences (07-basis-04).
References
Basten C.J., Weir B.S., and Zeng Z.B., 1997, QTL cartgrapher: a reference manual and tutorial for QTL mapping, Department of Statistics, North Carolina State University, Raleigh, NC,USA 
Bernacchi D., Beck-Bunn T., Eshed Y., Inai S., Lopez J., Petiard V., Uhlig J., Zamir D., and Tanksley S., 1998a, Advanced backcross QTL analysis in tomato.I. Identification of QTLs for traits of agronomic importance from Lycopersicon hirsutum, Theor. Appl. Genet., 97(3): 381-397 http://dx.doi.org/10.1007/s001220050908
Bernacchi D., Beck-Bunn T., Emmatty D., Eshed Y, Inai S., Lopez J., Petiard V., Sayama H., Uhlig J., Zamir D., and Tanksley S., 1998b, Advanced backcross QTL analysis in tomato. II. Evaluation of near-isogenic lines carrying single-donor introgrssion for disirable wild QTL-alleles derived from Lycopersicon hirsutum and L. pimpinellifolium, Theor. Appl. Genet., 97(1-2): 170-180 http://dx.doi.org/10.1007/s001220050882
Chen X., Temnynkh S., Cho T.G., and McCouch S.R., 1997, Development of a microsatellite framework map providing genome-wide coverage in rice (Oryza sativa L.), Theor. Appl. Genet., 95: 553-567 http://dx.doi.org/10.1007/s001220050596
Chen Y., Yang Q.W., Pan D.J., Qu Y.Y., Fan Z.L., Chen J., and Li C., 2008, Preliminary analysis of the Indica-Japonica differentiation among natural wild rice population in Gaozhou by SSR markers. Molecular Plant Breeding, 6(2): 263-267 (In chinese)
Lee S.J., Oh C.S., Suh J.P., Mocouch S.R., and Ahn S.N., 2005, Identification of QTLs for domestication-related and agronomic traits in an Oryza sativa × O. rufipogon BC1F7 population, Plant Breeding 124(3): 209-219 http://dx.doi.org/10.1111/j.1439-0523.2005.01092.x
Li C., Pan D.J., Mao X.X., Tu C.Y., Zhou H.Q., Fan Z.L., and Li X.F., 2006, The genetic diversity of gaozhou wild rice analyzed by SSR, Chinese Science Bulletin, 51(5): 562-572 http://dx.doi.org/10.1007/s11434-006-0562-1
McCouch S.R., Teytelman L., Xu Y., Lobos K.B., Clare K., Walton B., Fu B., Maghirang R., Li Z., Xing Y., Zhang Q., Kono I., Yano M., Fjellstrom R., DeClerck G., Schneider D., Cartinhour S., Ware D., and Stein L., 2002, Development and mapping of 2240 new SSR markers for rice (Oryza sativa L), DNA Res., 9(6): 199-207 http://dx.doi.org/10.1093/dnares/9.6.257 PMid:12597280 http://dx.doi.org/10.1093/dnares/9.6.199 PMid:12597276
Moncada P., Martinez C.P., Borrero J., Chatel M., Gauch Jr H., Guimaraes E., Tohme J., and McCouch S.R., 2001, Quantitative trait loci for yield and yield components in an Oryza sativa ×Oryza rufipogon BC2 F2 population evaluated in an upland environment, Theor. Appl. Genet., 102: 41-52 http://dx.doi.org/10.1007/s001220051616
Septiningsih E.M., Prasetiyono J., Lubis E., Tai T.H., Tjubaryat T., Moeljopawiro S., and McCouch S.R., 2003, Identification of quantitative trait loci for yield and yield components in an advanced backcross population derived from the Oryza sativa variety IR64 and the wild relative O. rufipogon, Theor. Appl. Genet., 107(8): 1419-1432 http://dx.doi.org/10.1007/s00122-003-1373-2 PMid:14513215 http://dx.doi.org/10.1007/s00122-003-1376-z PMid:14513216
Sun C.Q., Wang X.K., Li Z.C., Yoshimura A., and Iwata N., 2001, Comparison on the genetic diversity of common wild rice (Oryza rufipogon Griff.) and cultivated rice (O. sativa L.) using RFLP markers, Theor. Appl. Genet., 102(1): 157-162 http://dx.doi.org/10.1007/s001220051631
Tanksley S.D., and Nelson J.C., 1996, Advanced backcross QTL analysis: a method for the simultaneous discovery and transfer of valuable QTLs from unadapted germplasm into elite breeding lines, Theor. Appl. Genet., 92(2): 191-203 http://dx.doi.org/10.1007/BF00223376
Temnykh S., DeClerck G., Lukashova A., Lipovich L., Cartinhour S., McCouch S., 2001, Coutational and experimental analysis of micro satellites in rice (Oryza sativa L.): frequency, length variation, transposon associations, and genetic marker potential, Genome Res., 11(8): 1441-1452 http://dx.doi.org/10.1101/gr.184001 PMid:11483586 PMCid:311097
Tian F., Li D.J., Fu Q., Zhu Z.F., Fu Y.C., Wang X.K., and Sun C.Q., 2006, Construction of introgression lines carrying wild rice (Oryza rufipogon Griff.) segments in cultivated rice (O. sativa L.) background and characterization of introgressed segments associated with yield-related traits, Theor. Appl. Genet., 112(3): 570 - 580 http://dx.doi.org/10.1007/s00122-005-0165-2 PMid:16331476
Thomson M.J., Tai T.H., McClung A.M., Hinga M.E., Lobos K.B., Xu Y., Martinez C., and McCouch S. R., 2003, Mapping quantitative trait loci for yield, yield components, and morphological traits in an advanced backcross population between Oryza rufipogon and the Oryza sativa cultivar Jefferson, Theor. Appl. Genet., 107(3): 479-493 http://dx.doi.org/10.1007/s00122-003-1270-8 PMid:12736777
Xiao J., Li J., Grandillo S., Ahn S.N., Yuan L.P., Tanksley S.D., and McCouch S.R., 1998, Identification of trait-improving quantitative trait loci alleles from a wild rice relative, Oryza rufipogon, Genetics 150(2): 899-909 PMid:9755218 PMCid:1460369


. PDF(1690KB)
. HTML
Associated material
. Readers' comments
Other articles by authors
. Zhaobin Jing
. Yu Chen
. Dajian Pan
. Yanying Qu
. Zhilan Fan
. Jianyou Chen
. Chen Li
Related articles
. Advanced backcross analysis
. Oryza rufipogon
. Oryza sativa
. Statistic analysis
. Introgression lines
. Yield trait
Tools
. Email to a friend
. Post a comment